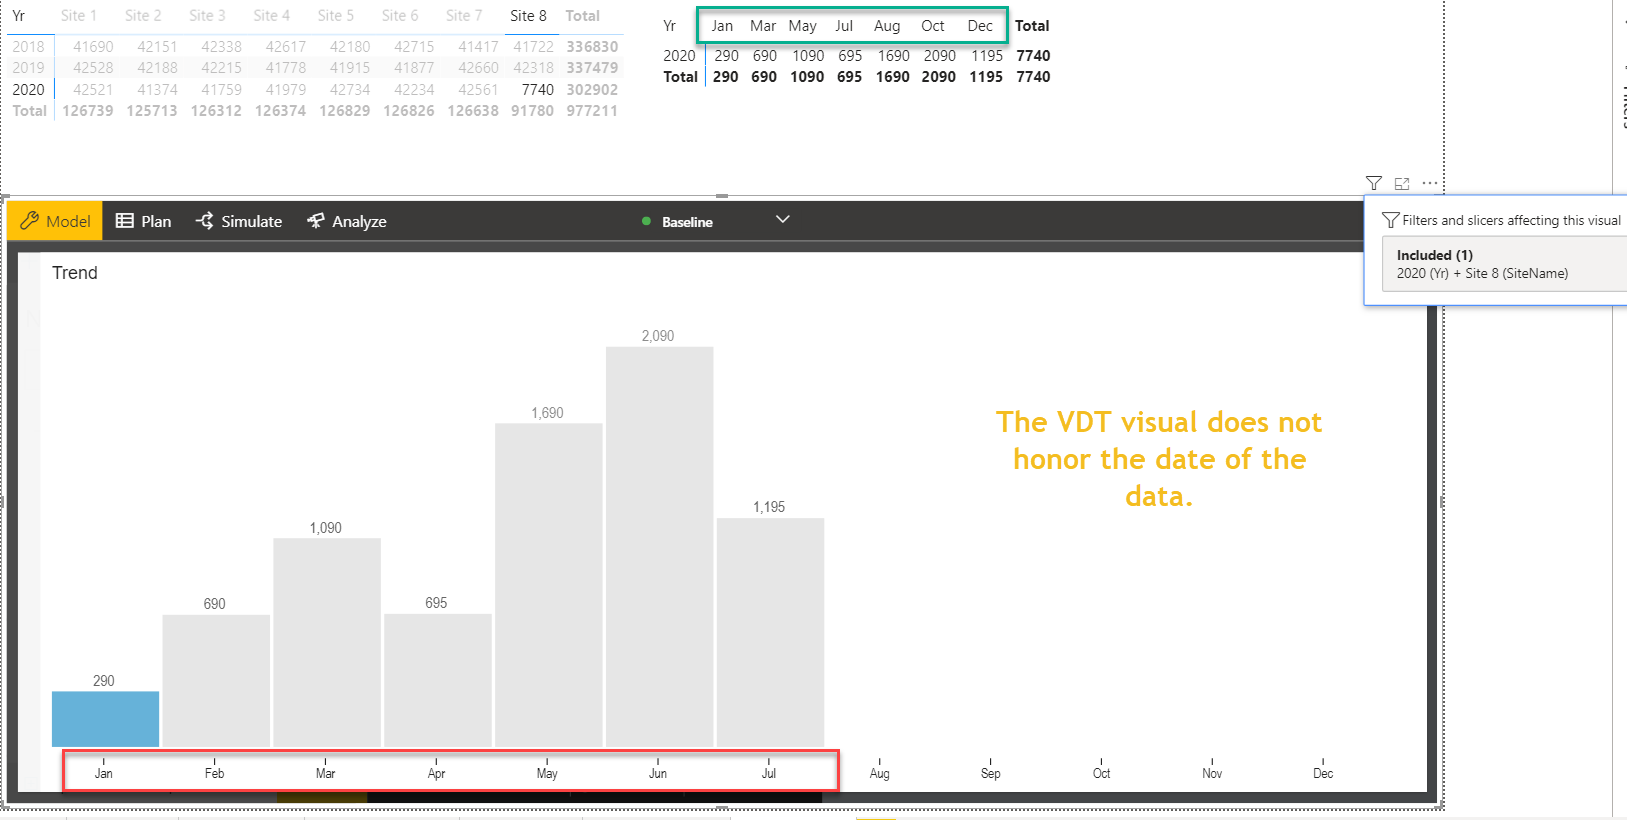
Error when there are blank periods of data, expect to see data in the correct month.
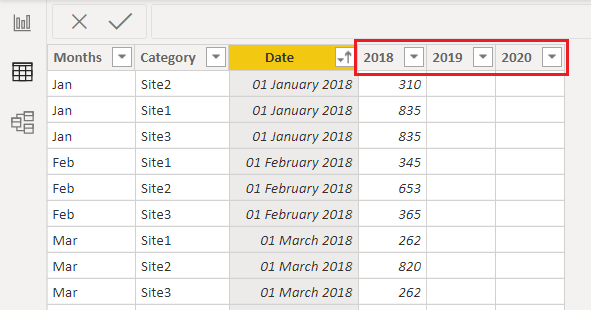
The source data is correctly displayed in the table visual.
VDT incorrectly shows the data as being in consecutive months.
Hello Peter,
Steps to get the correct result:
- Pivot the year column along with the value column that you have in the Query Editor to get 3 data series (2018,2019,2020).
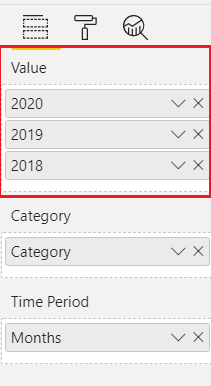
2. Add these data series to the Value field under Visualization pane.
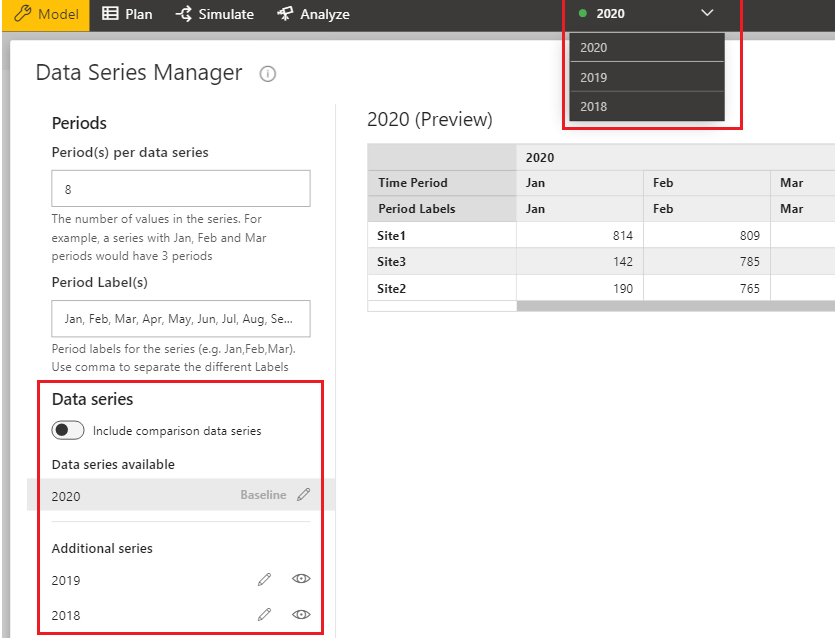
3. Select the year from the series dropdown to get data in the appropriate period.
Hello Peter,
In case you aren’t able to remodel the data, DAX measures can be of help to overcome this issue. With DAX you can create a measure for each year as data series using CALCULATE.
Hi Peter
We do not have time mapping in ValQ, so the better suggestion would be to create a dim table with twelve months.
Create a join between your table and newly created time dim table.
Use the time from time dim table in the period section and this should help you to solve this issue.
Thanks for the comment.
I do have a date dimension and have fact data at daily granularity.
It seems that if I use the daily granularity the values displayed in the VDT are for the first day of the month – not an aggregate for the month.
As an alternative I added a date dimension attribute being the First of the Month ie every day in May has 1st May as this attributes value.
This displays the data as expected where there are contiguous months of data but does not resolve the issue when the months are not contiguous.
Hi Varoothini,
I cant see this as a workable solution as you don’t always have the ability to remodel the data – We often use SSAS cubes as a source.
I’ve also been able to replicate this issue in one of the Valq demo exercises where the data is modelled similar to this suggestion.
I suspect the resolution is to create zero value fact records to fill the blanks. 🙁